Working With GIS data? Librarians Can Help With That


Whether its charting hurricane destruction or mapping progress in eradicating disease, geographic information systems (GIS) can help decision-makers solve local, state, and national problems.
GIS maps provide a format to visualize, manipulate, and analyze data points that correspond to geographic spaces. The systems are valuable for problem-solving because they give users a deeper look into spatial locations, said Shoreh Elhami, founder of the nonprofit GISCorps.
“That deeper insight and understanding in turn helps researchers and other users make smarter decisions,” she said. “GIS is used in numerous areas that impact a community including urban and regional planning, smart growth, environmental planning, health and human services, [and] utility planning/monitoring, to name a few.”
Since GISCorps launched in 2003, the organization has deployed more than 2,100 volunteers to 273 projects, including missions to “almost every major disaster since 2004,” Elhami said. Projects have included promoting rail transportation, mapping food insecurity to assist food bank distribution, and mapping photos of Hurricane Dorian’s destruction.
GIS technology can also be applied to personal projects, such as tracking family lineage and ancestral movement.
Using GIS software and data for the first time can be daunting—that’s where data librarians can help. Data librarians at academic and public libraries can assist GIS creators in tracking down the appropriate datasets for their personal and professional projects, point them to software, and walk them through the steps needed to spatially represent their data.
GIS Terms and Inspiration
New GIS users should have a basic understanding of data analysis and become familiar with some of the jargon in the field before embarking on a GIS project.
GIS Glossary
NUMERIC DATA: data that include a geographic component, such as census information, and are charted in space on GIS maps.
VECTOR DATA: spatial data represented by points, lines, or polygons and mapped using X and Y coordinates. Numeric data is paired with vector data to visualize it on a map.
RASTER DATA: surfaces represented by grids and cells, including image types such as aerial photographs, elevation models, or scanned maps.
LAYERS: categories of vector and raster data that are combined to create GIS maps. GIS maps allow users to view layers separately or in tandem.
FEATURES: common categories of information that each layer shares. Features are mapped using points, lines, and polygons.
ATTRIBUTES: details that describe a feature.
SHAPEFILE: the most common type of geospatial file. Shapefiles are a collection of vector data containing information about geographic features’ location and attributes.
Open-Source GIS Software
There are plenty of open-source, free tools to start creating GIS maps. Platforms can be used on mobile, desktop, or on the web.
These 20 platforms and tools—many of which include tutorials—are just some of the open-source options available for building GIS maps.
- GRASS GIS (Geographic Resources Analysis Support System) was originally developed by a branch of the U.S. Army Corps of Engineers.
- QGIS offers GIS tools for desktop, web, server and mobile platforms.
- GeoTools is a library of Java code that allows users to build their own GIS.
- gvSIG Association offers both desktop and mobile GIS platforms.
- OpenJUMP GIS is a desktop-based GIS originally developed by Vivid Solutions.
- MapWindow includes desktop GIS software and plug-ins.
- Flowmap allows users to visualize relationships between two points.
- GMT (Generic Mapping Tools) is a collection of tools for creating GIS maps and animations.
- SPRING was developed by Brazil’s National Institute for Space Research.
- TNTmips Free is designed for students. The free version and excludes some of the features of its professional products.
- uDig GIS is a desktop-based platform that allows for GIS viewing and editing.
- Geoserver is an open-source GIS server that allows for opening and editing GIS projects.
- GeoMajas is a collection of free, open-source GIS tools and libraries.
- MapGuide Open Source is a web-based GIS platform.
- OpenLayers allows users to create maps for webpages.
- TileMill is an open-source map design platform designed as part of the 2010 Knight News Challenge.
- SAGA GIS, short for System for Automated Geoscientific Analyses, is a desktop GIS tool.
- Whitebox GAT is a desktop GIS designed for geospatial analysis and geomatics-based education.
- OrbisGIS is a GIS developed by French researchers for research.
- PostGIS is a geospatial database extender for PostgreSQL, an object-relational database system, and can be used in conjunction with other open-source tools.
Five Sources of Inspiration for Your Next GIS Project
There are different types of maps users can create using GIS, depending on what users wish to visualize and the problems they want to solve. Popular types of GIS maps include heat maps, category maps, quantity maps, bubble maps, or dot density maps. The examples below reveal just some of the different applications of GIS.
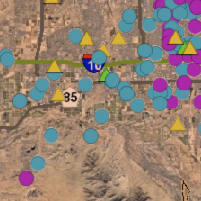
Dot Density Map:
MARICOPA COUNTY ANIMAL CARE & CONTROL MAP
shows dogs and cats that have been lost and found within the past three days in Maricopa County, Arizona.
Source: Maricopa County Animal Care and Control
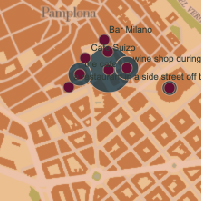
Bubble Map:
THE SUN ALSO RISES: A DRINKING MAP
documents the number of drinks characters had in different locations in Ernest Hemingway’s The Sun Also Rises.
Source: Theresa Quill
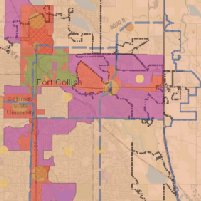
Category Map:
FCMAPS
is a tool used by the city of Fort Collins, Colorado, to map two dozen different categories of data points, including the economic health of its neighborhoods.
Source: City of Fort Collins, CO, GIS
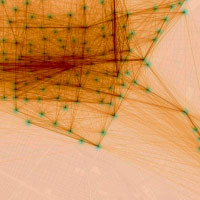
Heat Map:
PUBLIC RENTAL BIKE TRIPS
in Guadalajara, Mexico, were mapped by Hennessy Becerra.
Source: Hennessy Becerra
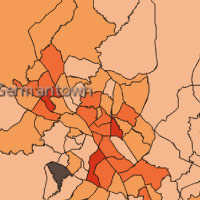
Quantity and Dot Density Map:
THE CAPITAL AREA FOOD BANK’S HUNGER HEAT MAP
shows how food insecure different areas in the Washington, D.C., region are, as well as locations of food distribution centers. The food bank was assisted by GISCorps in creating the map.
Source: GISCorps/Capital Area Food Bank
How Data Librarians Can Help With Your GIS Project
Public and academic libraries are expansive resources for data projects because they subscribe to data sources not widely available on the Internet. For example, the Syracuse University library offers data sources such as aerial photos, city zoning maps, geographic databases, and data repositories. The New York State Library provides onsite and remote access to resources ranging from scientific journals to U.S. census data dating to 1790 to historical maps of U.S. cities. The New York Public Library also offers a list of online data sources, free GIS software, and tutorials.
Public libraries often subscribe to local and national databases. Most libraries require users to log into those databases—physically in the library or remotely—with a library card or university affiliation.
Data librarians, who specialize in managing data and supporting research, can guide patrons to appropriate data sources and visualization tools, and their knowledge of data sources positions them as strong resources for researchers. A number of libraries even host workshops to teach GIS basics.
“There’s a lot of potential that you can use GIS data with, but the critical thing is you would have to know where to get the GIS data to map with your location names and then … what tools to actually visualize the map,” Syracuse iSchool professor Jian Qin said. “Data librarians can provide the training and can point you to the sources in a way you can find your data, the tools. And if you need training, they can even teach you.”
Job demand for data librarians is increasing, and there’s a need for librarians who can use and teach GIS skills as data collection proliferates. Overall librarian jobs were expected to grow 6 percent between 2018 and 2028—about the same as the average growth rate projected during that period for all jobs, according to the U.S. Bureau of Labor Statistics.
“Data librarianship is developing fast, and it’s moving compared to 10 years ago when I first entered into this field,” Qin said. “It has changed a lot and matured a lot, as well.”
Citation for this content: Syracuse University’s online Master of Science in Library and Information Science program